The best from Neil Patel
The Google Analytics Conversion Funnel Survival Guide
Every online business has steps that people must take to become a customer. You can say that ad supported businesses are an exception – and that’s true, because people who click on ads aren’t customers!
Whether people are attempting to sign up for your online service, or purchase a product from your website, there will be a certain number of steps they will have to take in order to give you money.
Funnels help us see this process (or processes) easily, by giving us a visual representation of the conversion data between each step. This allows us to:
- Determine what steps are causing customer confusion or trouble.
- Figure out what language or copy might be altering our customer’s emotional behavior during checkout or sign up.
- To be aware of bugs, browser issues and other technical nuisances.
Today’s post is a very in-depth look into how to set up and use funnels in Google Analytics. Let’s dive in!
Funnels Provide Greater Insights than Goals Alone
As essential as goals are in Google Analytics, they serve by themselves more as basic KPIs (key performance indicators) than as actionable starting points for conversion optimization. Most goal pages – such as a purchase receipt or a signup confirmation – are preceded by several other pages designed to drive towards the goal; funnel tracking allows you to begin isolating problems at any point in your visitors’ conversion paths so you can take meaningful steps towards optimization.

See How My Agency Can Drive Massive Amounts of Traffic to Your Website
- SEO – unlock massive amounts of SEO traffic. See real results.
- Content Marketing – our team creates epic content that will get shared, get links, and attract traffic.
- Paid Media – effective paid strategies with clear ROI.
BOOK A CALL
Case Study: www.nebiketours.com
Let’s say that your website, www.nebiketours.com, offers personalized bicycle tours of the New England countryside. You don’t actually sell the tours online – the primary call to action for your website visitors is to submit a lead generation form.
Define the Lead Form Submission as Your Goal
You can’t create a funnel in Google Analytics without first setting up a goal:
- Log into Google Analytics, drill down into one of your profiles, and click Admin in the top navigation.
- Click the Goals tab.
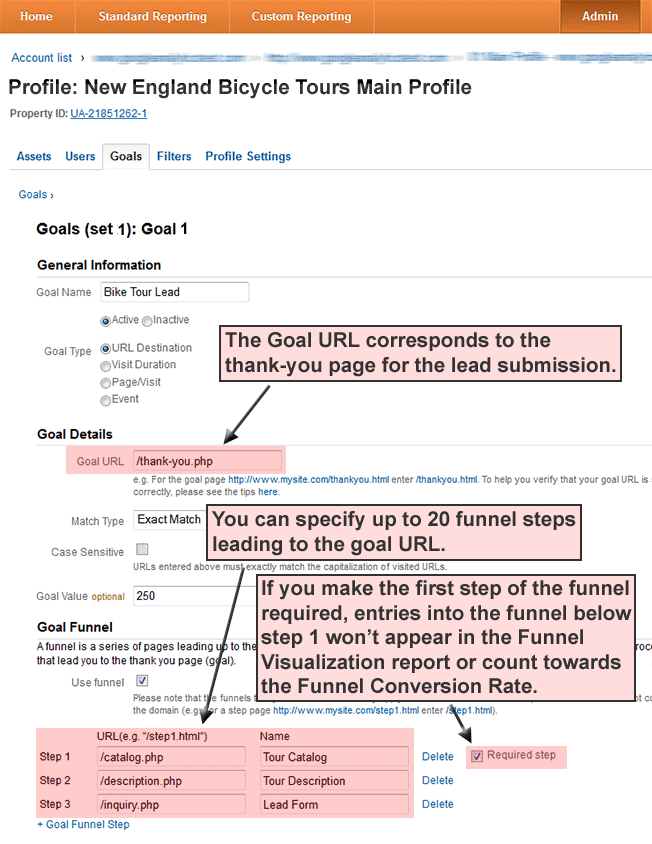
- Enter a Goal Name, such as Bike Tour Lead.
- Enter a Goal URL, such as /thank-you.php.
- Leave the Match Type as Exact Match, unless you need to account for multiple variations of your goal or funnel URLs.
- It is often useful to enter a Goal Value even for unmonetized lead generation, since it allows Google Analytics to calculate metrics such as Page Value and Per Visit Goal Value.
Set Up Your Funnel
Before you save your goal, you have the option of adding a funnel:
- Select the Use Funnel checkbox.
- Enter URLs and names for the funnel steps:
/catalog.php – Tour Catalog
/description.php – Tour Description
/inquiry.php – Lead Form - Select the Required Step checkbox for the first funnel step.
Step 3 is often recommended for generating simpler funnel data but is not obligatory. If you do, in fact, want the Funnel Visualization report and the Funnel Conversion Rate to also count entries into the funnel below step 1, keep Required Step unchecked.
Funnel Conversion Rate
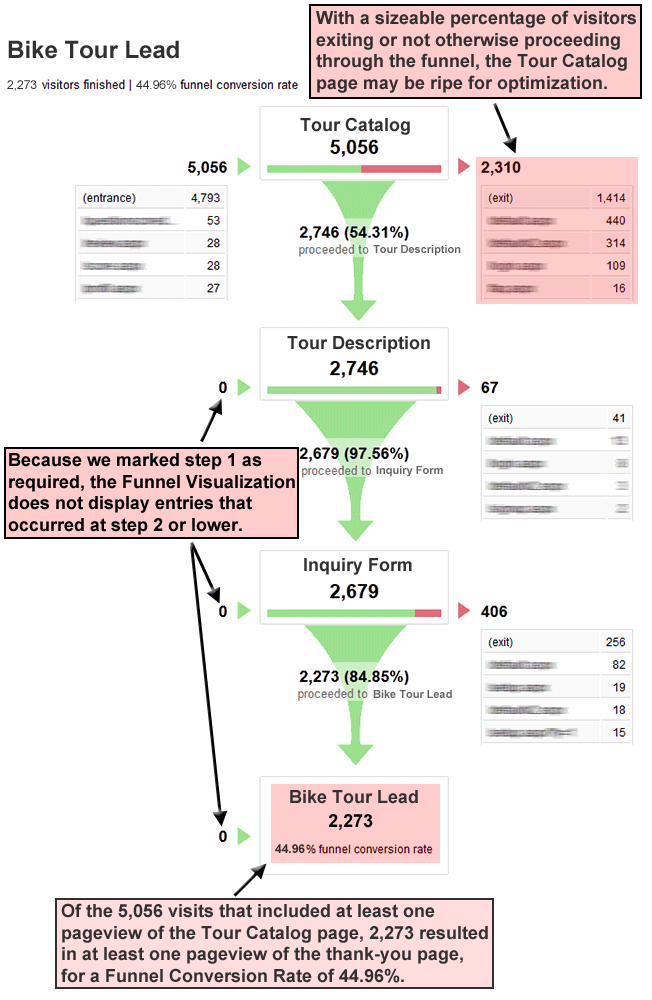
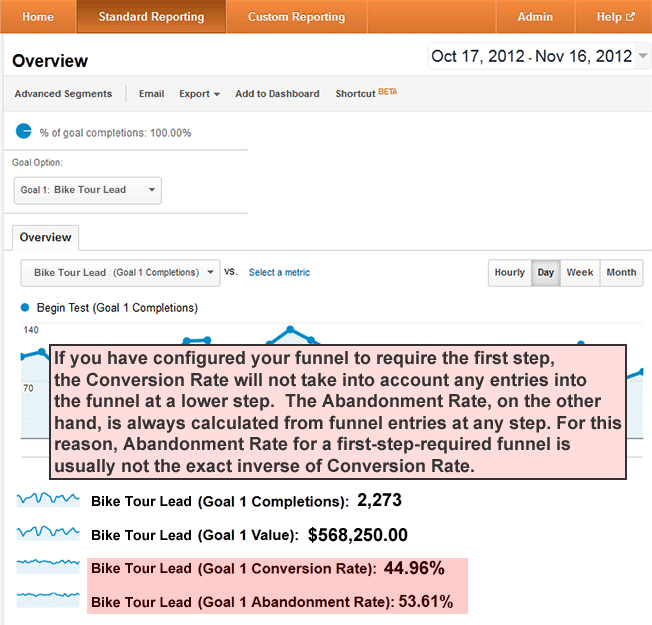
After you have set up your goal and funnel, and your profile has had some time to collect data, the Funnel Visualization report will display perhaps the single most definitive funnel performance metric in Google Analytics: the Funnel Conversion Rate. If, during funnel setup, you made Step 1 of the funnel required as recommended above, the Funnel Conversion Rate indicates the percentage of visits that included at least one pageview of the first step before at least one pageview of the goal page.
In addition to the overall Funnel Conversion Rate, you can use the report to assess step-to-step drop-off.
Multiple Pageviews Are Consolidated into Unique Pageviews
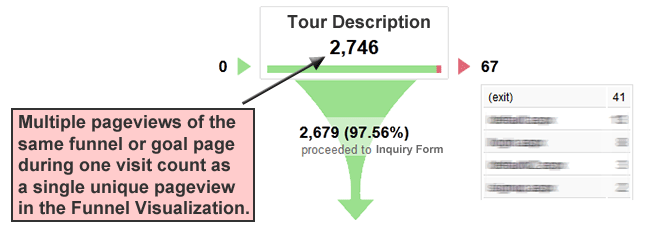
The Funnel Visualization report consolidates multiple pageviews that occur for the same page during a single visit into a unique pageview. In our example, a visitor who viewed catalog.php five separate times in a single visit before viewing description.php, inquiry.php, and thank-you.php two times each would generate only a single pageview at each step of the funnel.
This is quite helpful: in conversion analysis, the fact that a visitor has seen the page at least once is generally more significant than the total number of times that the visitor has seen it.
Pageviews Can Occur Nonsequentially for a Funnel Match
Our example funnel and goal pages were defined above as:
catalog.php > description.php > inquiry.php > thank-you.php
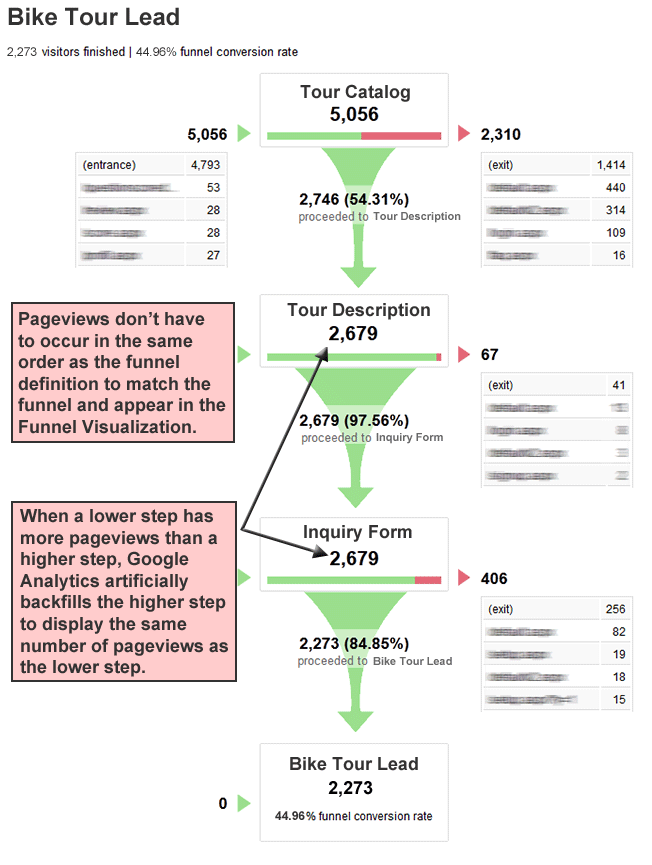
The following sequences of pageviews during a visit would match the funnel definition and count towards the Funnel Visualization:
Matching visit: catalog.php > description.php > inquiry.php > thank-you.php
Matching visit: description.php > catalog.php > inquiry.php > thank-you.php
Matching visit: catalog.php > maps.php > description.php > inquiry.php > thank-you.php
Middle Pageviews Don’t Have to Occur for a Funnel Match
Using the same example funnel as above, the following sequences of pageviews during a visit would also count towards the Funnel Visualization:
Matching visit: catalog.php > inquiry.php > thank-you.php
Matching visit: catalog.php > maps.php > inquiry.php > thank-you.php
Higher Funnel Steps Are Backfilled as Needed
As Brian Clifton explains in Advanced Web Metrics with Google Analytics, steps higher in the funnel are artificially “backfilled” when a lower step has a greater number of pageviews.
You’re reading correctly: if there were 2,579 pageviews of description.php and 2,679 pageviews of inquiry.php, the Funnel Visualization will show 2,679 pageviews for description.php as well, even though the page was bypassed and never viewed for 100 of those 2,679 pageviews displayed.
Abandonment Rate Is Not Always the Inverse of Conversion Rate
If your Funnel Conversion Rate is 44.96% as above, you might expect the Abandonment Rate to be 55.04% for a total of 100%, but this is not usually the case if your first funnel step is marked as required. While the Funnel Conversion Rate in the Funnel Visualization report respects the first-step requirement, Abandonment Rate does not; hence, the seeming discrepancy.
A visit that included pageviews of description.php and inquiry.php but not catalog.php or thank-you.php:
- would increase the Abandonment Rate, even though the first page of the funnel wasn’t viewed
- would not figure into the Funnel Conversion Rate, because the first page of the funnel wasn’t viewed
By the same token, a visit that included pageviews of description.php, inquiry.php and thank-you.php but not catalog.php:
- would decrease the Abandonment Rate, even though the first page of the funnel wasn’t viewed
- would not figure into the Funnel Conversion Rate, because the first page of the funnel wasn’t viewed
No Advanced Segments in the Funnel Visualization Report
Because visitor segmentation is so fundamental to effective Web analytics, the biggest drawback of the Funnel Visualization report is perhaps the unavailability of built-in and custom Advanced Segments.
Let’s say that you’re paying $500USD monthly for a banner ad on www.newenglandvacations.com to generate clickthroughs to www.nebiketours.com. Within your Google Analytics profile, you could define an Advanced Segment based on traffic from www.newenglandvacations.com and then apply that segment to most other reports to view data exclusively for traffic originating from that one website.
Inconveniently, Advanced Segments are not available in the Funnel Visualization report.
For Advanced Segmentation, Create Filtered Profiles
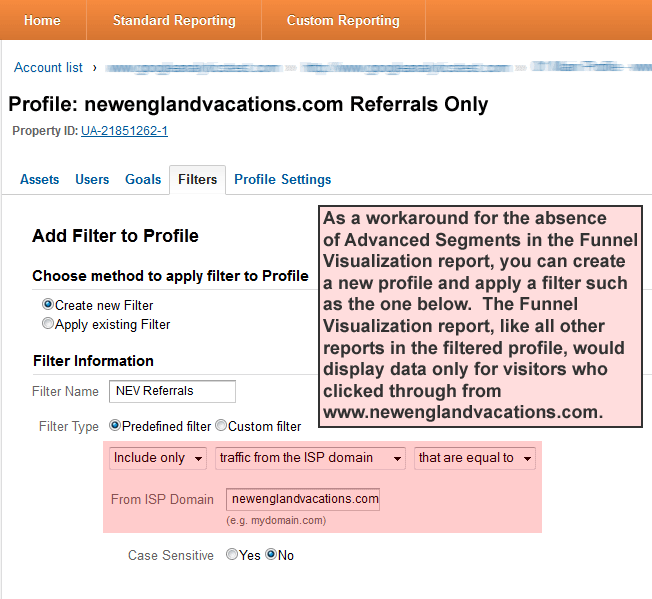
As an alternative or a supplement to Advanced Segments, you could easily create a separate profile and filter it for traffic originating only from www.newenglandvacations.com. After setting up your goal and funnel in that profile, you’d be able to view the Funnel Visualization report and the Funnel Conversion Rate for that one traffic source.
You can set up additional filtered profiles for any traffic segment for which you wish to view the Funnel Visualization report. You can create up to 50 profiles within each Google Analytics account, so there is normally no reason to hesitate in generating as many profiles as you need for visitor segmentation in Funnel Visualizations or for any other reporting purposes.
Advanced Segments Are Available in the Goal Flow Report
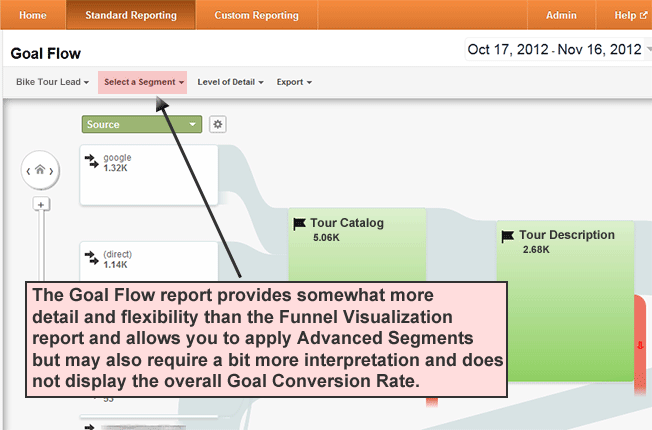
Another option for viewing funnel data is the Goal Flow report, which is in some ways similar to the Funnel Visualization. Goal Flow is somewhat more flexible and detailed and does allow Advanced Segments, but it does not calculate a single funnel conversion rate metric and generally requires a bit more interpretation.
View the Reverse Goal Path Report for Additional Funnel Ideas
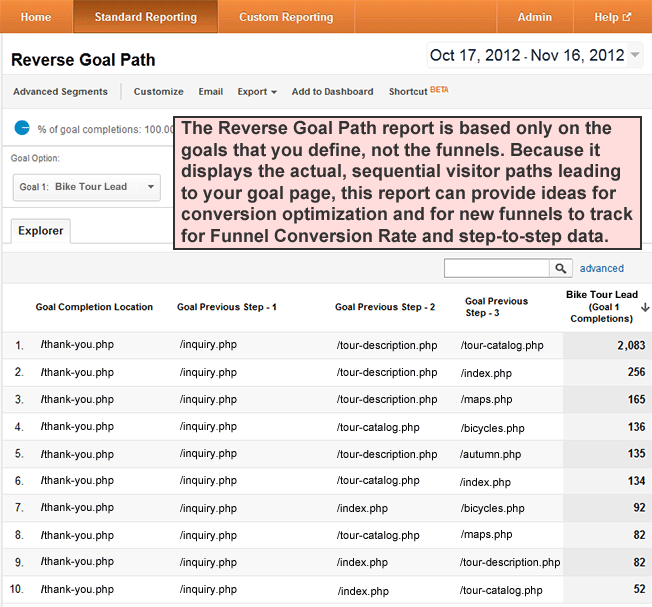
If the Reverse Goal Path report indicates that many visitors are reaching your goal page through a path that you did not anticipate, you can set up a corresponding funnel and begin formally monitoring Funnel Conversion Rate and step-to-step drop-off for that path.
Use Virtual Pageviews to Create a Funnel for a Single Form
By representing a single form as a funnel, you can isolate drop-off to specific form fields, but how can you track individual fields when each funnel step in Google Analytics corresponds to a separate pageview?
The answer is virtual pageviews. Without loading a new page into the browser, you can generate a “virtual” pageview as the user completes fields and clicks the submit button. These virtual pageviews will match any corresponding goal URL or funnel step that you have defined, just as an actual pageview would.
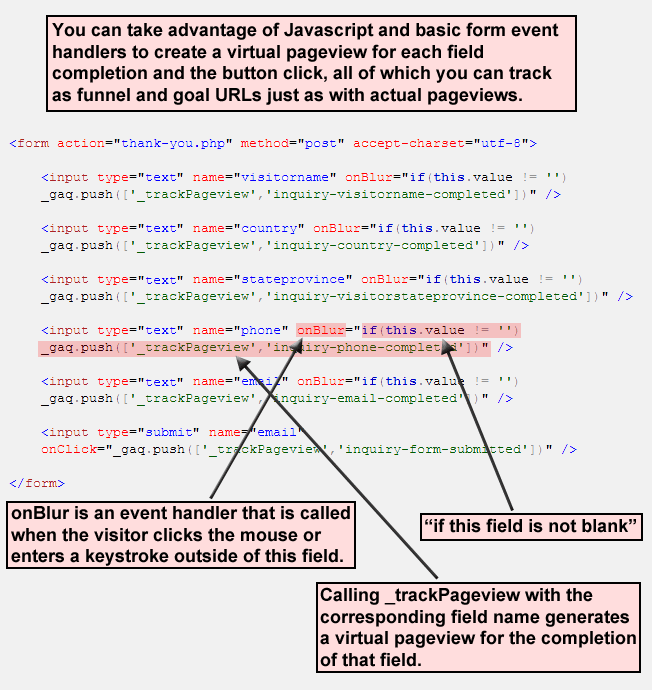
Thanks once more to Brian Clifton for demonstrating this useful technique to track forms as funnels.
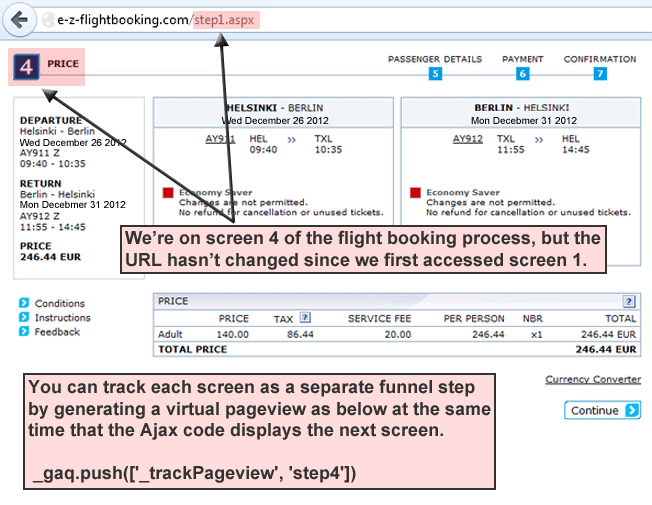
Use Virtual Pageviews When the Page URL Doesn’t Change
Many websites now take advantage of Ajax technology, which allows Web browsers to communicate with Web servers in the background and update the page without loading a new URL. This creates a smoother user experience, as it avoids the flicker that usually occurs when the browser requests a new page, but it also poses a greater challenge to Google Analytics pageview tracking since the URL does not change.
Similar to the approach detailed above for tracking a single form as a funnel, you can take advantage of virtual pageviews to track a multiscreen conversion process in which the page URL doesn’t change.
Goals and Funnels Are Not Retroactive, So Don’t Delay
As a final note, keep in mind that Google Analytics does not calculate goal completion retroactively, so make sure to set up your goals and funnels as early as possible in your implementation process. Equipped with your funnel reports and some specialized funnel know-how, you can immediately begin to isolate problems in key website processes, create better end-user experiences, and significantly optimize your website’s conversion performance.
About the Author: Eric Fettman is the developer of googleanalyticstest.com, a free resource for Google Analytics training and GA Individual Qualification preparation. He regularly provides GA pointers at gatipoftheday.com.


